3D and AI sensors for all traffic: from counting and turning movement counts to traffic safety. Improve traffic, save lives and money.
Counting is a good place to start if you want to get to know the traffic, but it is not enough to really improve mobility and traffic safety. Viscando offers you deeper insights into numbers, behaviours and interactions, as well as accident risks.
Traffic Counting
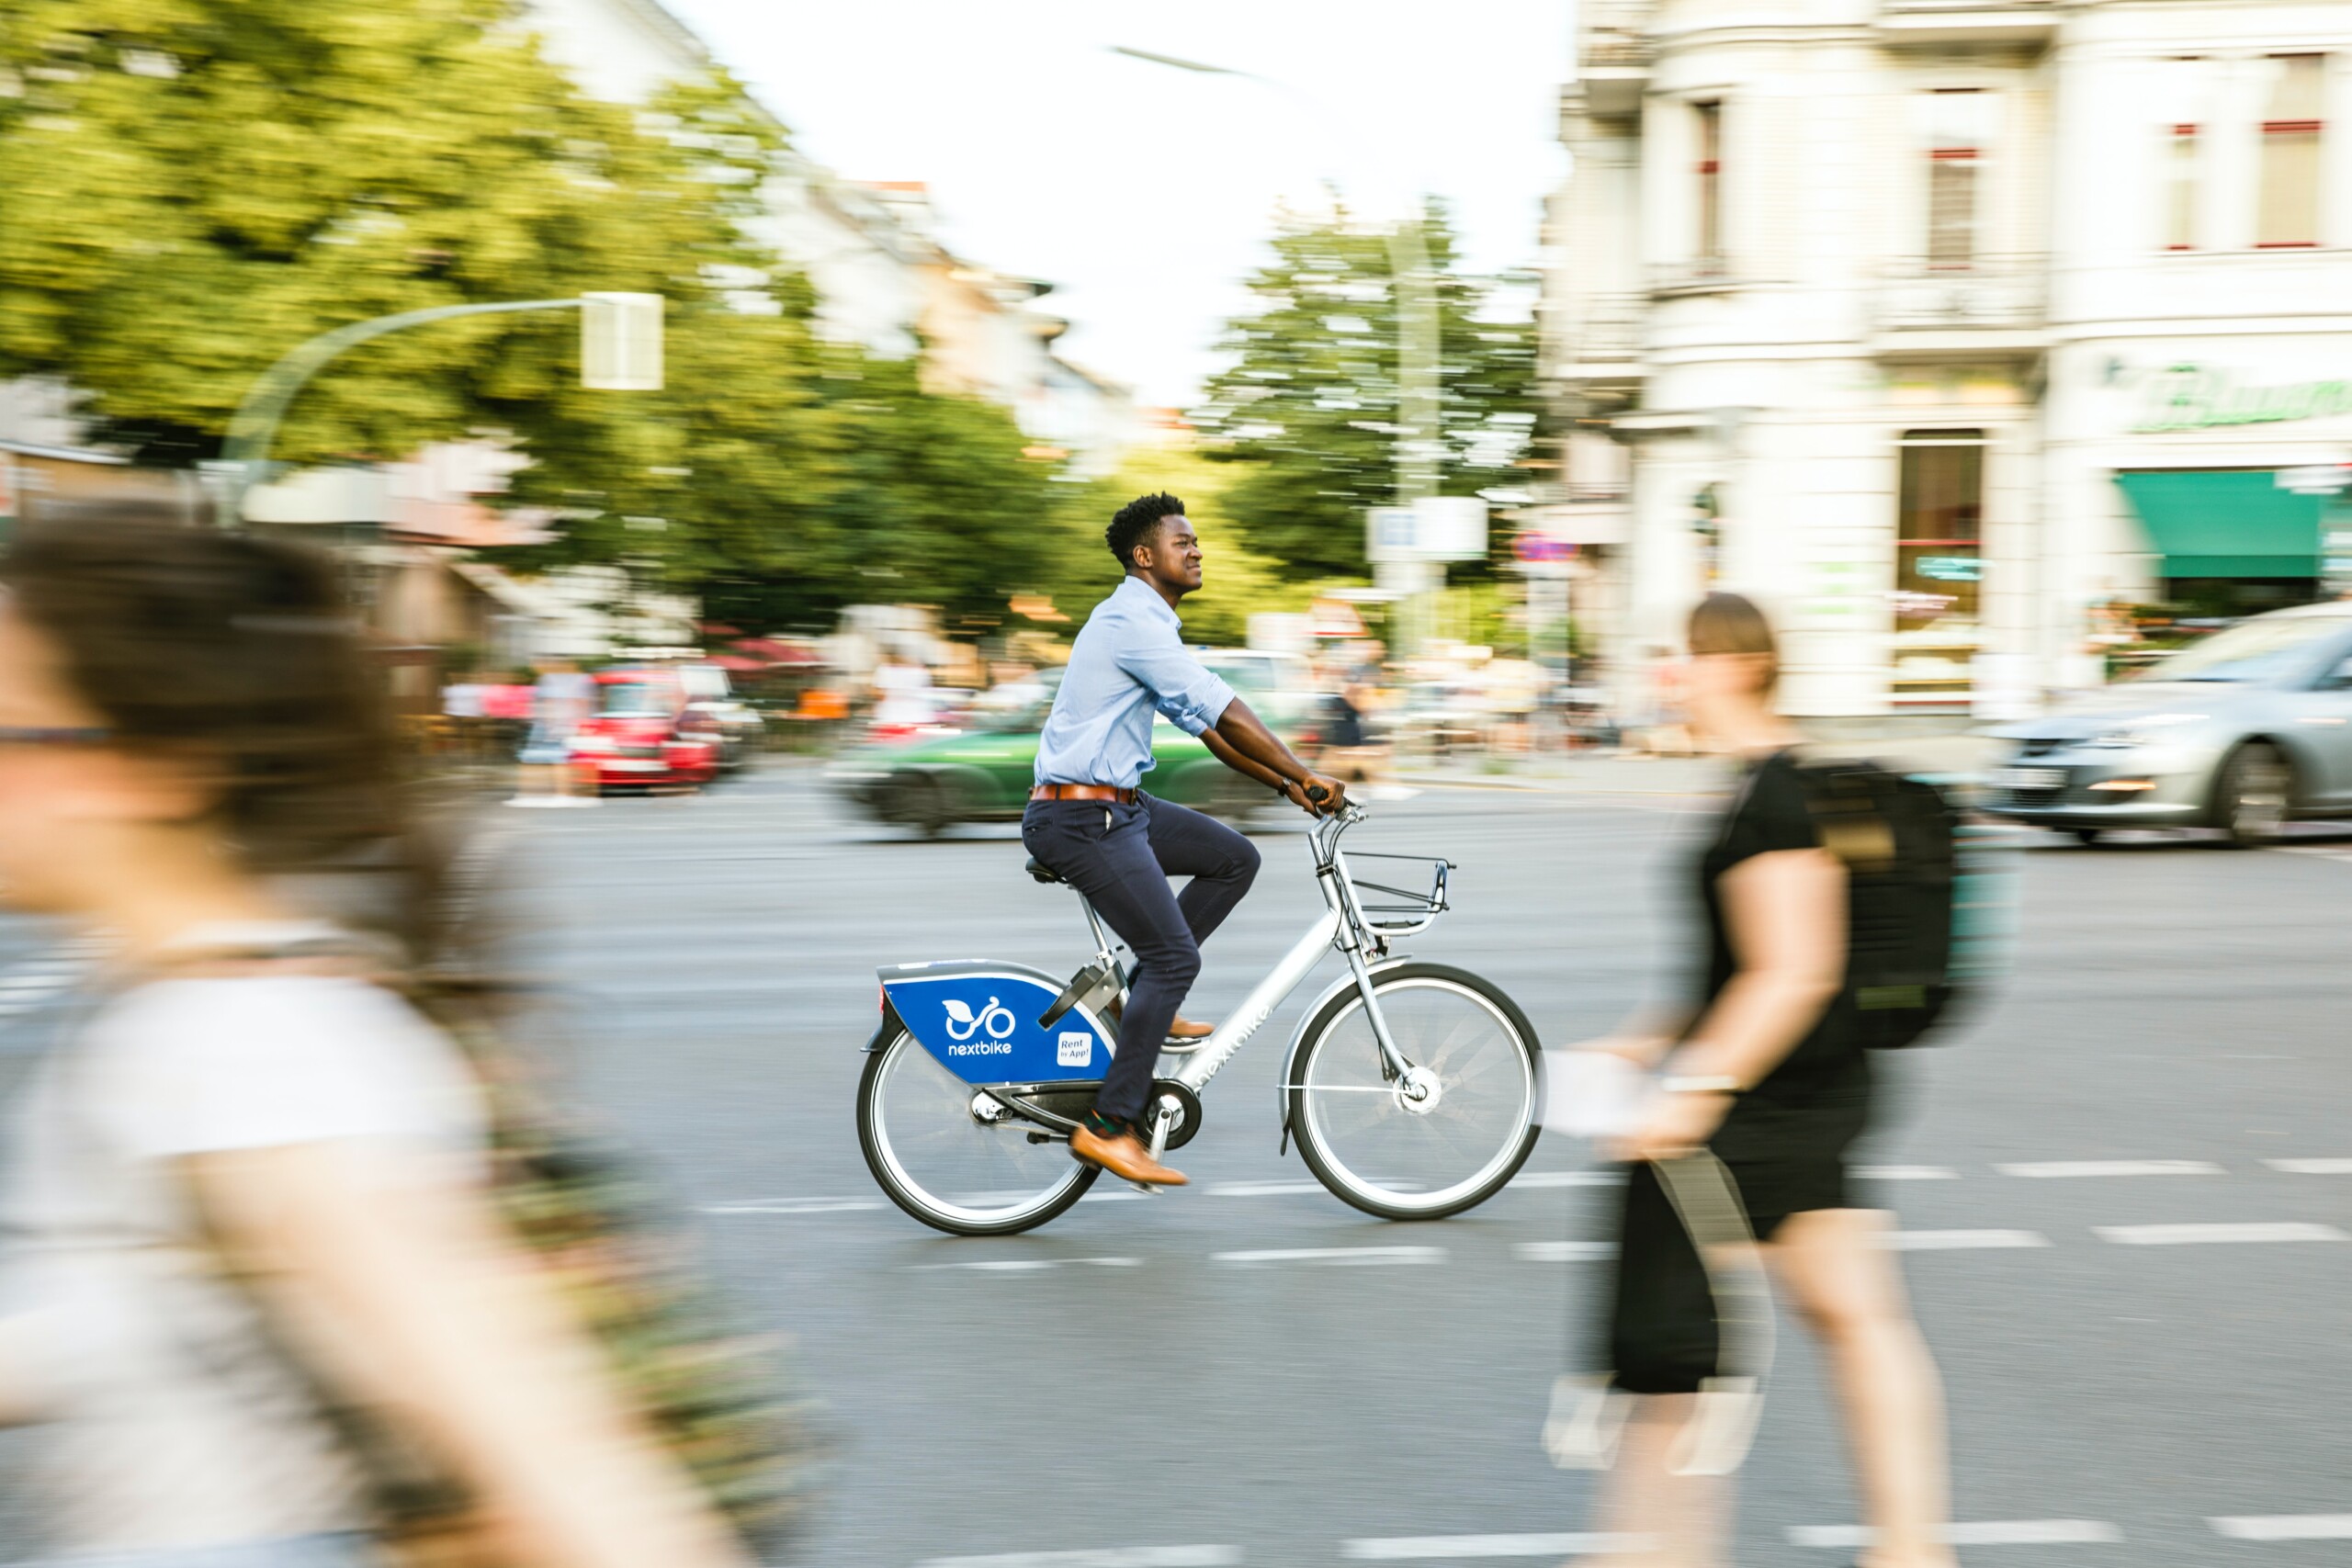
Count pedestrians, cyclists and motor vehicles with our 3D and AI sensors. Works equally well on roadways and in complex multi-modal situations.
Behaviour & Interactions
We provide detailed objective data and insight into road-user behaviour, interactions and accident risks.
Before & After
Changes in cities are costly and affect large numbers of people. We can help you to quickly evaluate the effects on mobility and safety.
We provide insight into numbers that matter.
 0
0
 0
0
 0
0
With Viscando’s 3D and AI sensor OTUS3D, one single unit can provide more understanding of the traffic than hundreds of observations and traditional traffic counting. One unit measures all traffic types simultaneously: pedestrians, cyclists and motor vehicles.
Benefit from the flexibility and richness of detail in our measurements and analyses. Measure whatever you like, wherever and whenever you like. OTUS3D can measure entire intersections, in mixed traffic, during both summer and winter.
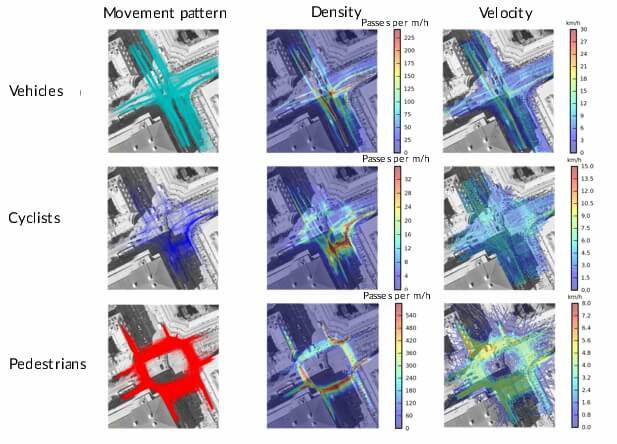
The traffic measurements and traffic analyses range from counting and speeds to quantifying behaviour and interactions. You get a visual picture of how traffic moves through the area, and a clear insight into mobility and accident risks.
We made OTUS3D to simplify your day-to-day work. Whatever the weather, time of year, early morning or rush hour, the sensor system provides you with precise traffic data. It ensures your decisions stand on four strong pillars:

One unit alone can cover up to 35x50 metres, and more units can be coupled together to cover an even wider area.

Simultaneous registration of pedestrians, cyclists and motor vehicles – also in mixed traffic. Including direction and speed.

Go beyond counting. Understand behaviours and accident risks without standing in the rain. Objective and quantitative.

Real-time measuring and reporting provide highly detailed data, for both temporary and continuous measurements.

Measure for a day or decades. Our flexible solution makes it possible to carry out a wide range of measurements, based on your needs.

Our system is GDPR compliant. Images are not sent or stored but immediately transformed into numbers and graphs.
To meet the climate goals, every city needs to provide better infrastructure for the sustainable modes of transportation: pedestrians and cyclists. With our smart traffic sensors, you can directly see trends in the modal mixture. In this way, we simplify your work in defining and achieving the sustainability goals.